Property management reporting
Data that puts
you in the drivers seat
Transform complex data into clear, visual insights that help you plan, pivot and outperform, with Analytics+.
Team & Individual KPIs
Keeping your teams accountable has never been easier, with simple views, enabling you to report and track based on how your teams work.
Configurable notifications
Pulse allows you to create configurable notifications to keep you informed of changes to your most important metrics. Get email alerts for thresholds, anomalies or on your own schedule.
Fine-Tune Your View
Unlock deeper insights with intelligent filtering. Tailor your reports to spotlight the data that truly matters including zooming in on property managers, offices, tenants, owners, suburbs, and beyond.
property management reporting
Taking the
analysis out of data
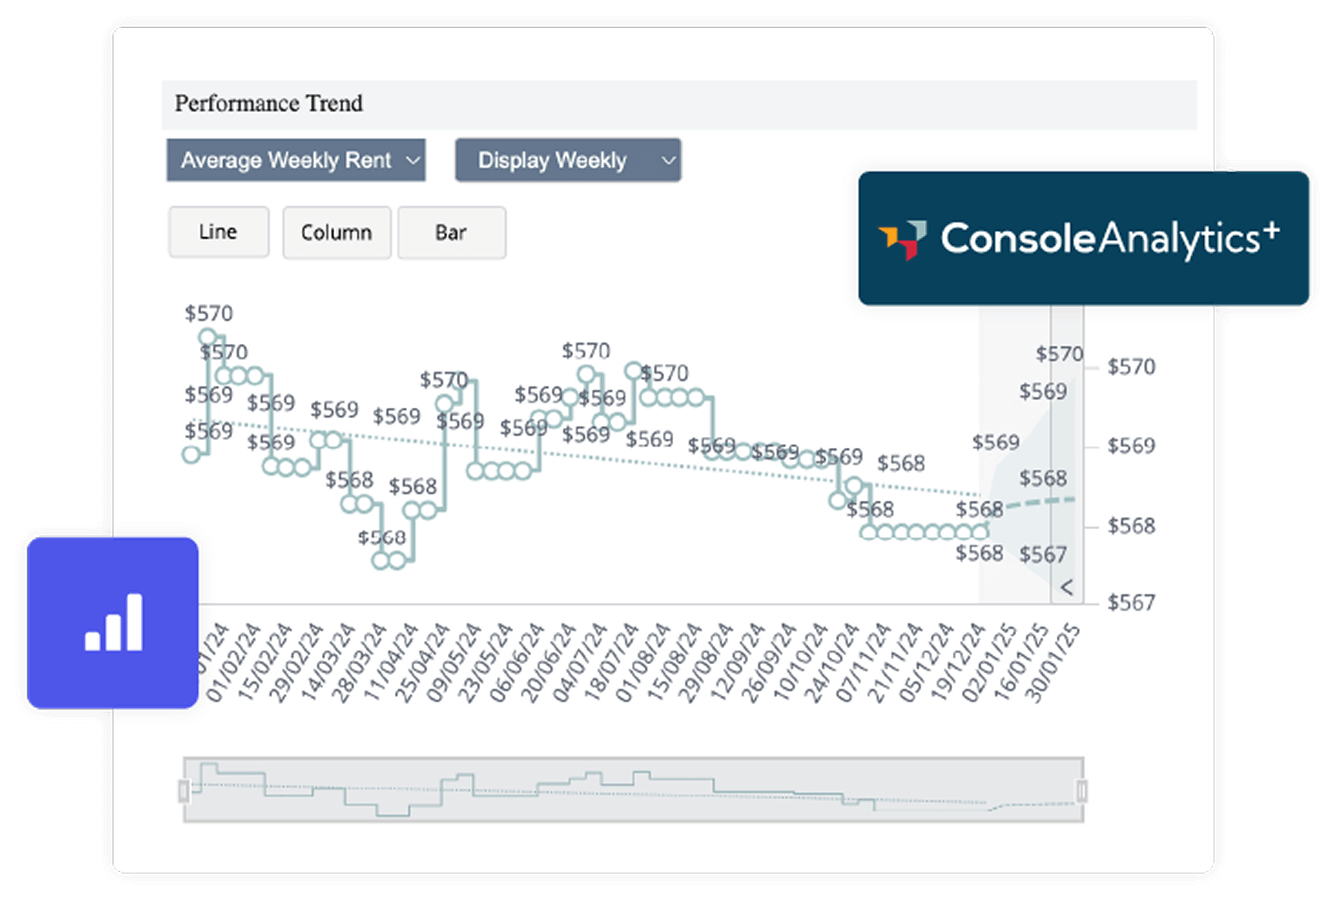
Forget sifting through endless spreadsheets. With Analytics+, you can quickly spot patterns, track progress, and plan your next steps.
From timelines to trend lines, beautifully designed visualisations on a calendar, map, or chart to make your data crystal clear.
property management business intelligence
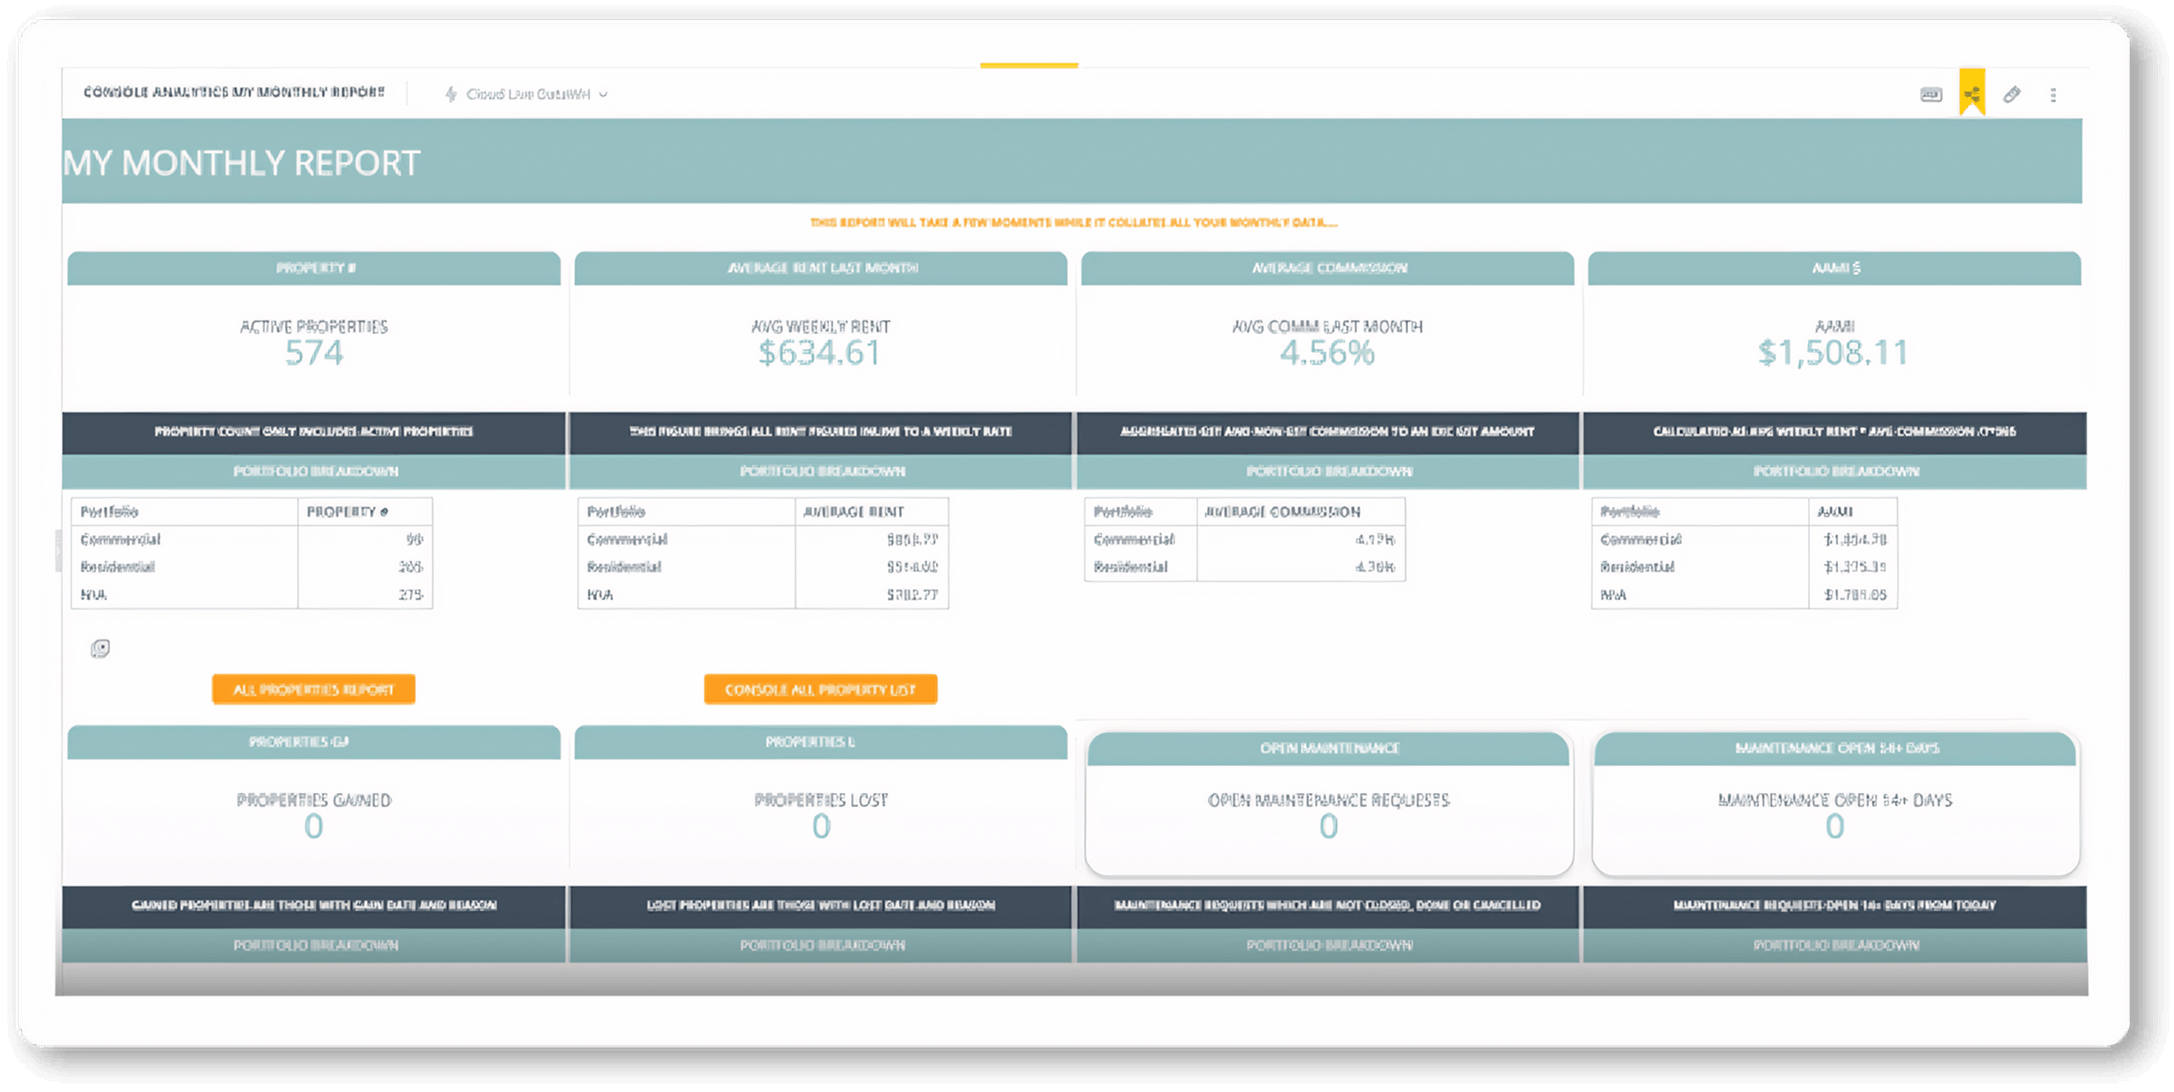
Track what matters most
Keep your finger on the pulse with sleek KPI dashboards. Instantly see how your team is performing, track portfolio trends, and access property insights that keep you informed and ready to act.
customisable reporting dashboards
Your metrics, your way
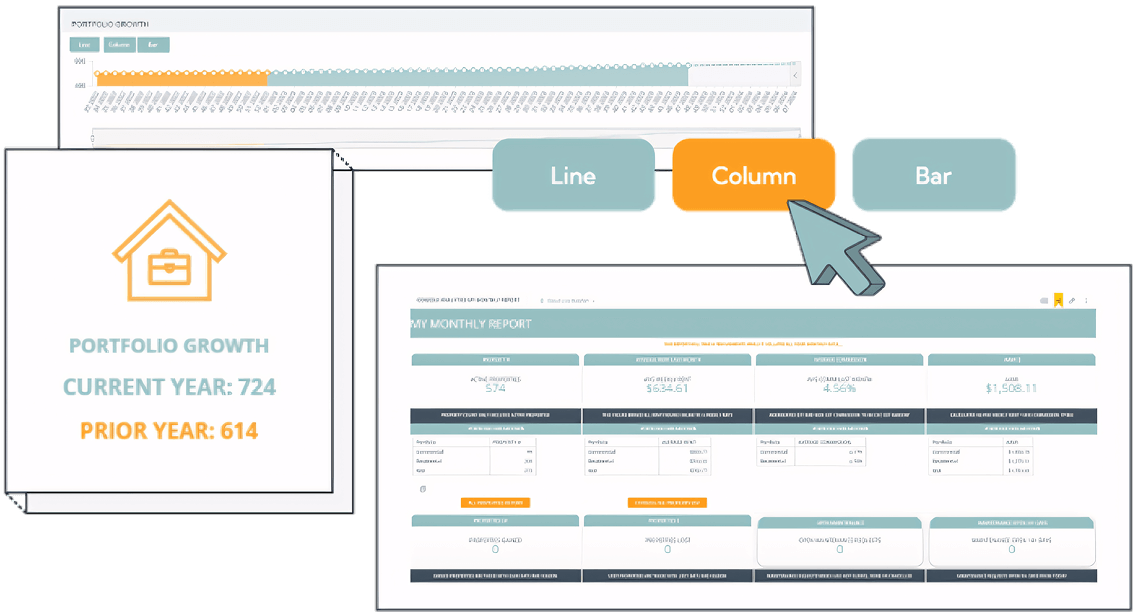
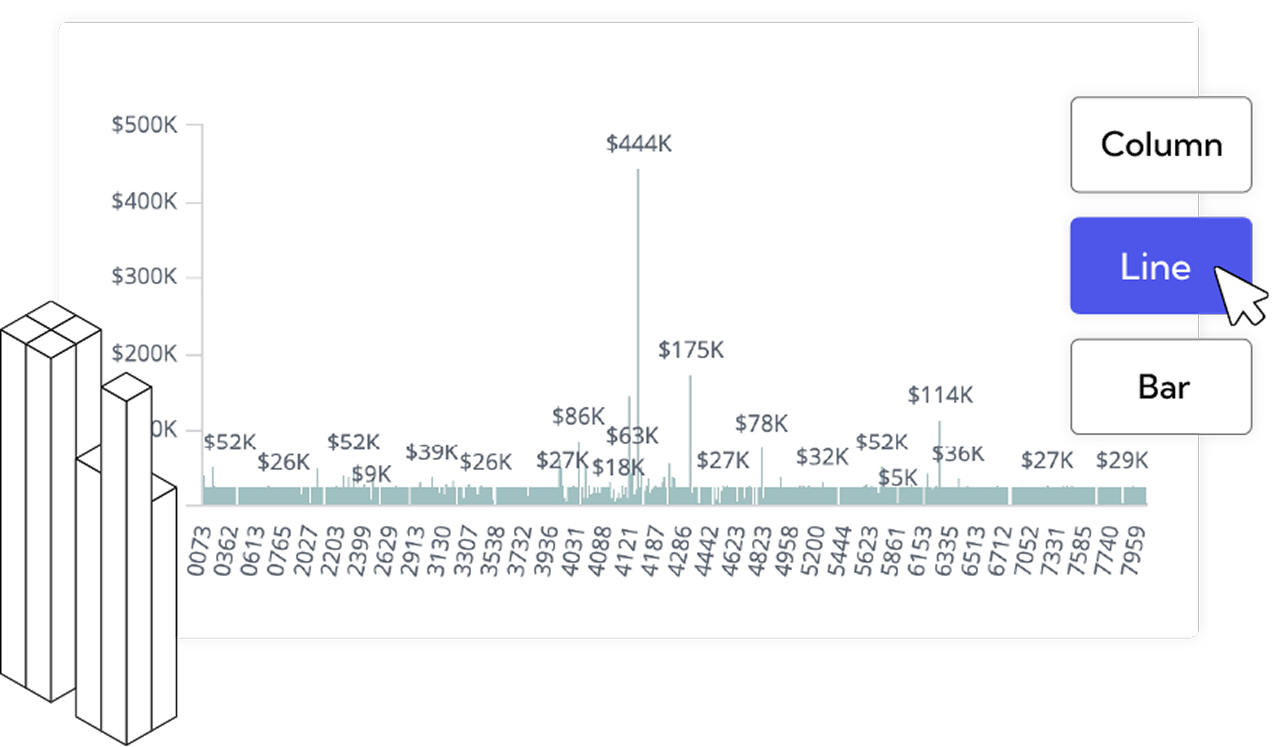
Choose from over 30 customisable reports to shine a light on every part of your business, from inspections to lease renewals.
Easily switch between graph types or build reports tailored to your agency’s unique needs.
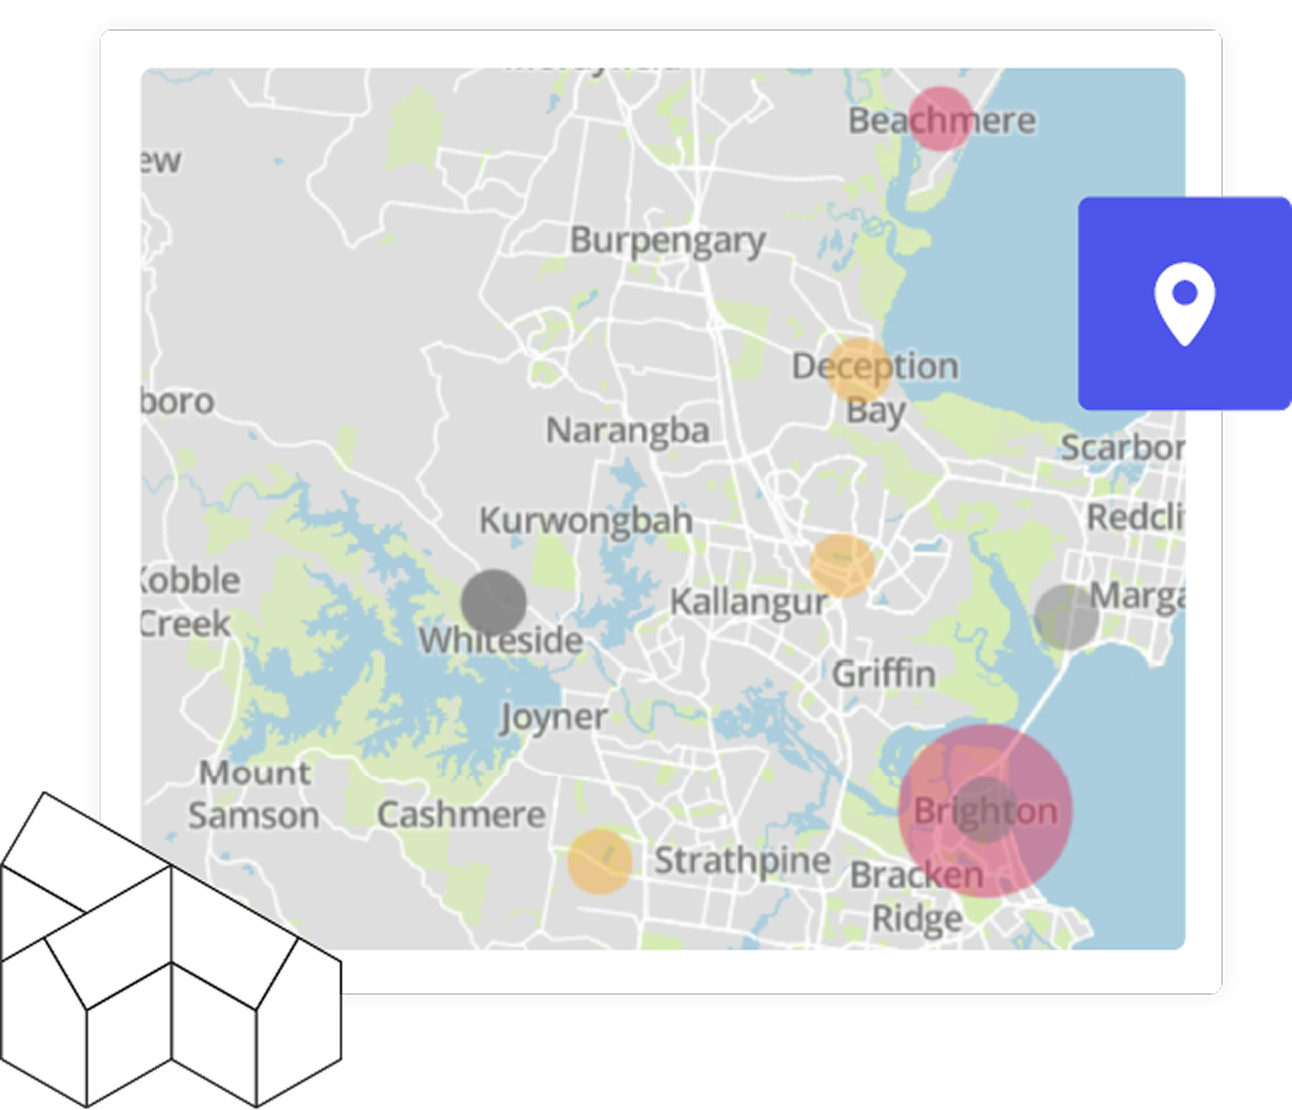
reporting with suburb drill-down
Zoom in on trends with map view
Explore portfolio insights with interactive map views, showcasing rental amounts by location, and more. Use adjustable features to drill down into the details, visualising your data to stay ahead of the curve.
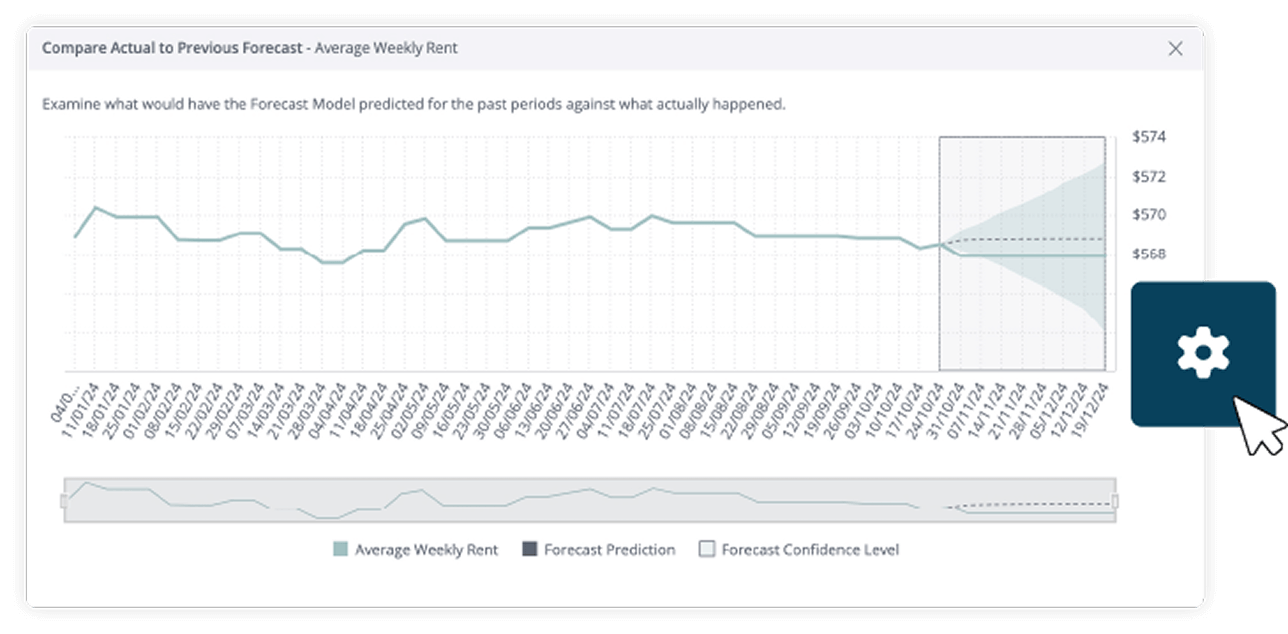
business intelligence & AI
See the future
Utilise a suite of AI-infused dashboards to help predict trends and forecast your data into the future, giving you insights your competitors wish they had.
real estate market reports
Deep dive
into your data
Need deeper insights? Effortlessly drill down to Office, Portfolio, or Property levels using the fields available, or quickly apply filters to compare timeframes, uncover trends and make data-driven decisions with ease.

Alana, Absolute Real Estate
Nicholas
Nicholas

Try the AI-infused
reporting engine for yourself
- Award-wining software
- Easy to use
- Gain greater insight than ever before
Reports, guides and blog post on the topics that matters
.png)
Frequently Asked Questions
Business intelligence is the act of using data science, business analytics and visualisation of data for decision making. These decisions help organisations grow much faster as they become more data-driven with greater insights into their organisation based on facts and figures, and less 'gut feeling'.
Property management-specific business intelligence is combining the essentials of a property management business with how they report into effective business intelligence practices. Analyticsᐩ offers a targeted form of reporting and business intelligence suitable for real estate and property management specifically. Instead of customising everything you need to report on in property management with a third party software, we have built 30 highly-valuable reports including 3 KPI dashboards that are all customisable, and tailored to a property management agency's needs.
Analyticsᐩ equips you with essential property management reporting tools in our Accelerate tier. But if your goal is to make data-driven decisions and drive growth for your agency, the Premium tier is designed to take your insights to the next level.
With a Premium Console Cloud subscription, you'll unlock all our premium benefits. Specifically for Analyticsᐩ, this includes:
Advanced reporting with 3 core KPI Dashboards.
Additional advanced reports to explore deeper insights.
Access to the full suite of Accelerate tier reports.
We understand that diving into data can sometimes feel overwhelming. That’s why Analyticsᐩ is designed with property management-specific metrics, focusing on the insights you care about most.
Built with input from our customers, this tool is tailored to be highly valuable and user-friendly. Here’s how we’ve made it easier for you.
Analyticsᐩ is here to make property reporting simpler, clearer, and more actionable-so you can focus on growing your business.